Graph of Functions
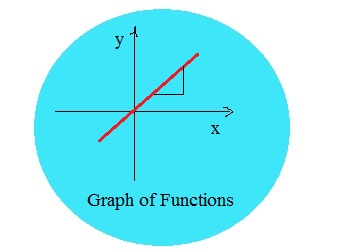
We can present functions in graphical form through substituting all input values as x-axis and all output values as y-axis. Where y = f(x). We plot the graph of function in similar way we plot the graph for equations. The graph of a function is being written like f(x) = 2x -1 f(x) = √x+2 … Read more