We can present functions in graphical form through substituting all input values as x-axis and all output values as y-axis. Where y = f(x).
We plot the graph of function in similar way we plot the graph for equations.
The graph of a function is being written like
- f(x) = 2x -1
- f(x) = √x+2
- g(x) = x2 + 1/3
- h(x) = x3 -1
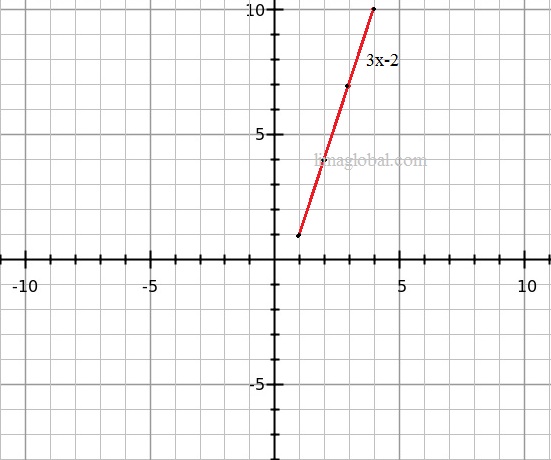
Example 1
Graph of function f(x) = 3x -2 where x ≥ 1
Answer ; First make table to get the x and y coordinates
| x | f(x) = y = 3x – 2 | ( x , y ) |
| 1 | 1 | ( 1 , 1 ) |
| 2 | 4 | ( 2 , 4 ) |
| 3 | 7 | ( 3 , 7 ) |
| 4 | 10 | ( 4 , 10 ) |
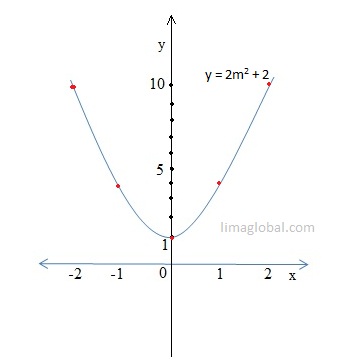
Example 2
Plot the graph of the function given by y = 2m2 + 2, where -2 ≤ m ≤ 2.
Answer ;
First make table to get the x and y coordinates
| x | f(x) = y = 2m2 + 2 | ( x , y ) |
| -2 | 10 | (-2 , 10) |
| -1 | 4 | ( -1 , 4 ) |
| 0 | 1 | ( 0 , 1 ) |
| 1 | 4 | ( 1 , 4 ) |
| 2 | 10 | ( 2 , 10 ) |
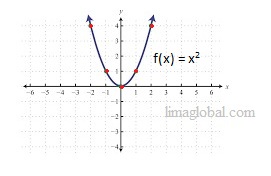
Example 3 Plot the graph of function of f(x) = x2
Answer
x f(x)
-2 4
-1 1
0 0
1 1
2 4
Exercise ;
Plot the graph of function of the following
- f(x) = √ x
- f(x) = │x│
- f(x) = 1/x
- f(x) = 5x -1 , for -2 ≤x ≤ 4
- f(x) = 5 – m2 , for 1≤m≤4